 Control Tower
 Control Tower documentation
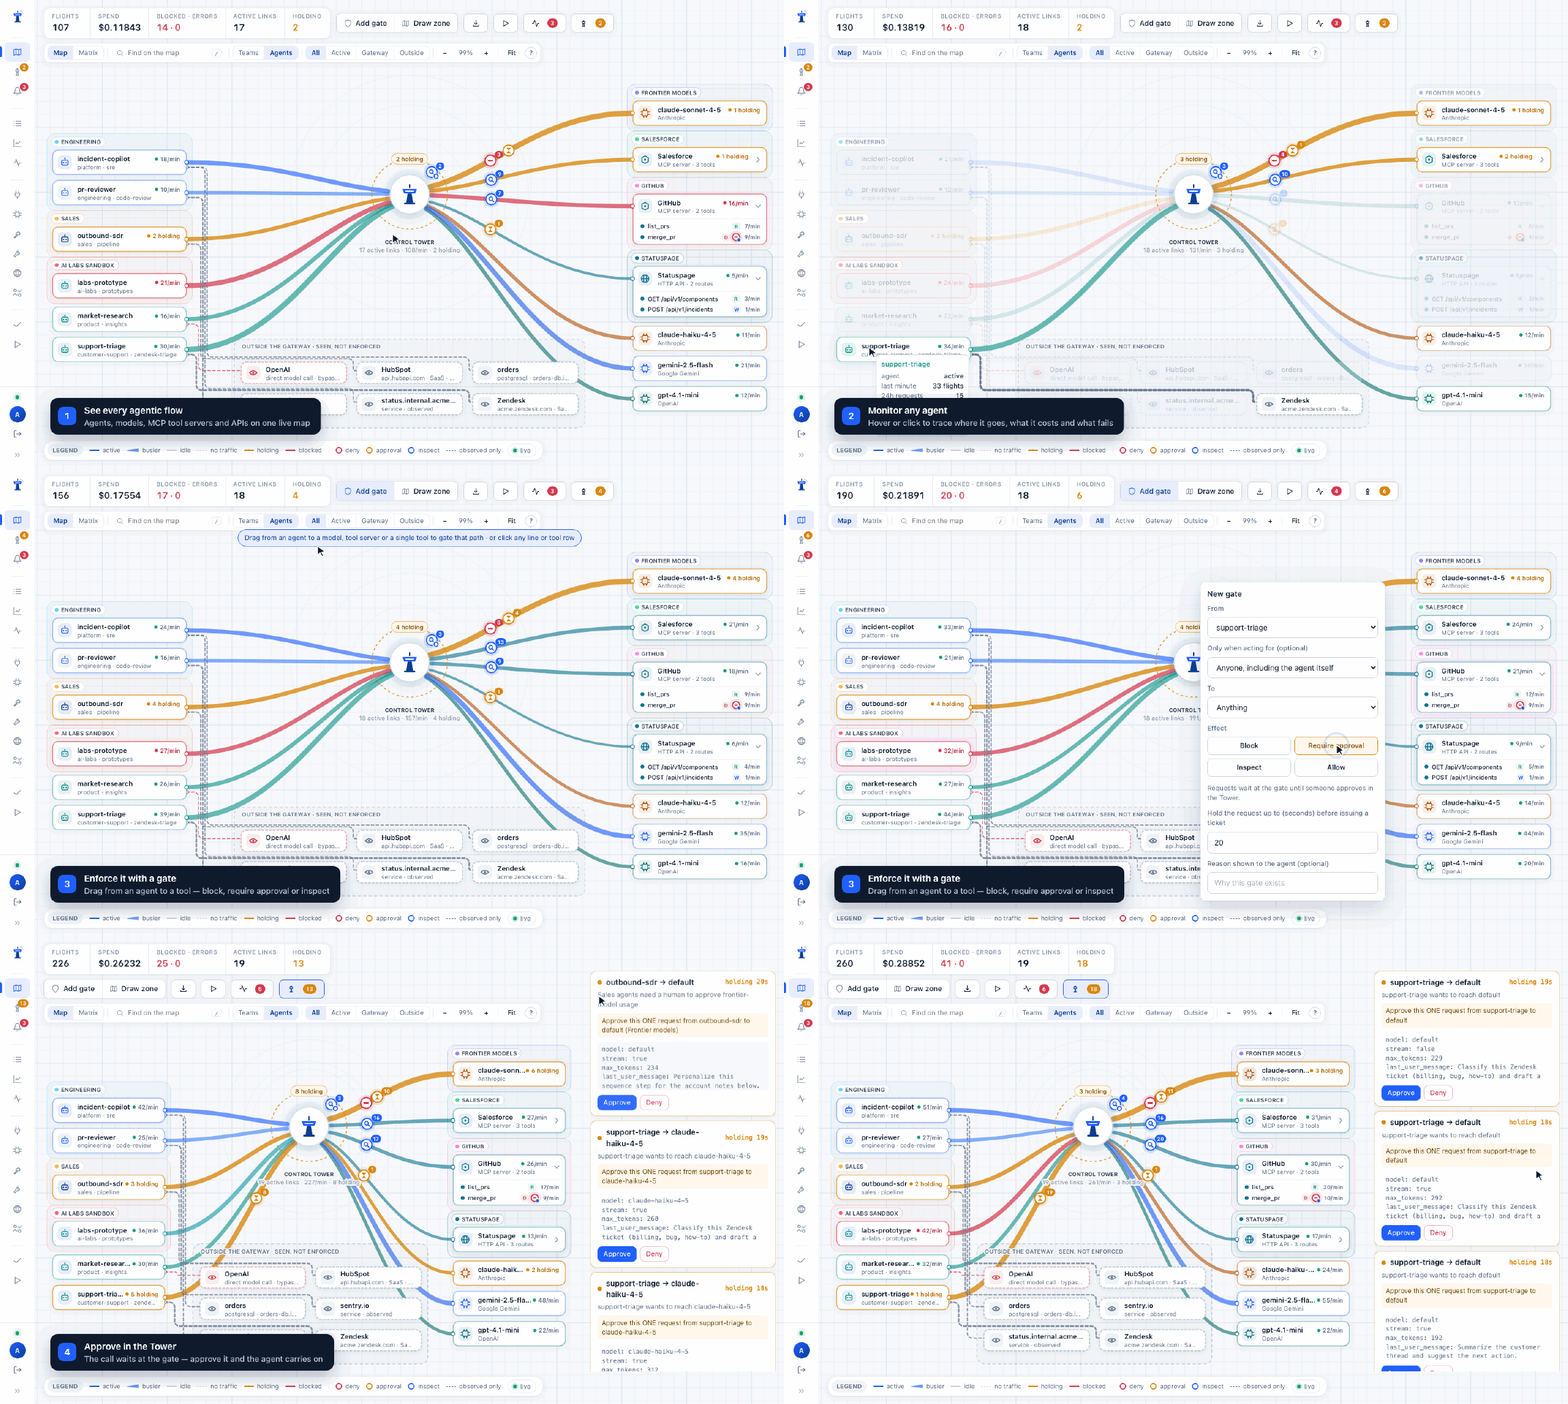
Control Tower is a self-hosted AI gateway with a live map of every agentic data flow. Agents call models, MCP tool servers and HTTP APIs through it; you see every path on the map, put gates on the ones that matter, approve risky calls as they happen, and account for every call.
Start here
- Getting started — from
docker runto your own agent on the map, in five minutes. - Install — Docker, Compose, Render, Fly.io, Railway, any container platform, or from source; upgrades and backups.
- Connect your agents — OpenAI SDKs, the OpenAI Agents SDK and Codex, Claude Code, LangChain, MCP clients, plain HTTP. Step by step: Claude Code, Claude Desktop, Codex in the ChatGPT desktop app, Codex CLI.
Set up
- Providers and models — connect OpenAI, Anthropic, Gemini, Bedrock, Vertex AI, Azure, Ollama…; models added on first use; aliases, load balancing and fallbacks.
- Images, audio and providers' own APIs — images, speech, transcription, moderation, rerank and completions; Gemini's and Bedrock's own SDKs through the gateway.
- Keys, budgets and limits — one key per agent, with allowed models and tools, rate limits and budgets.
- MCP tool servers — register tool servers; per-key tool visibility.
- HTTP APIs and observed traffic — route REST APIs through the gateway, and map what doesn't go through it.
- A2A agents — put remote agents that speak the Agent2Agent protocol behind the gateway.
- Agents calling agents — follow calls from one agent to the next, and gate on whom a call is made for.
Control
- The Airspace — reading the map, gates (block, require approval, inspect), simulation, approvals in the Tower, zones.
- Guardrail services — Presidio, Lakera, Bedrock Guardrails, Azure AI Content Safety, OpenAI moderation or your own URL, asked by inspect gates.
- Policy as code — zones and gates as YAML, with a preview before anything changes.
- Alerts — console, Slack and webhooks; approving from Slack.
- Monitoring — Flights, the Ledger, the data-flow inventory, Prometheus metrics.
- Exporting flights — every call to your OpenTelemetry, Datadog, Splunk, S3 or webhooks, as metadata.
- People and roles — admins, approvers and viewers; adding people; lost passwords.
- Running several instances — Postgres and Redis behind a load balancer.
- What is enforced — the boundary, stated honestly.
Reference
- Configuration — command-line flags, environment variables, the admin key.
- Config file —
config.yamlfor providers, models, fallbacks, MCP servers and alerting, field by field. - Demo mode — a synthetic fleet to explore with.
- Architecture — how a request flows, what is stored, retention, limits.
- API reference — every gateway, admin and health endpoint.
- Troubleshooting — errors agents see and how to fix them.
- Changelog — what changed in each release.
Screenshots in these pages are taken from a real server by pnpm build && pnpm docs:screenshots.